Built for Neurologists, By Neurologists.

The AI scribe and revenue dashboard built for neurologists.

See more patients. Finish your notes before you leave the room. Know exactly where your revenue is leaking.

60-Day Free Trial — Then $85/month per user. Prefer to evaluate first? Watch the three product demos or request a walkthrough.

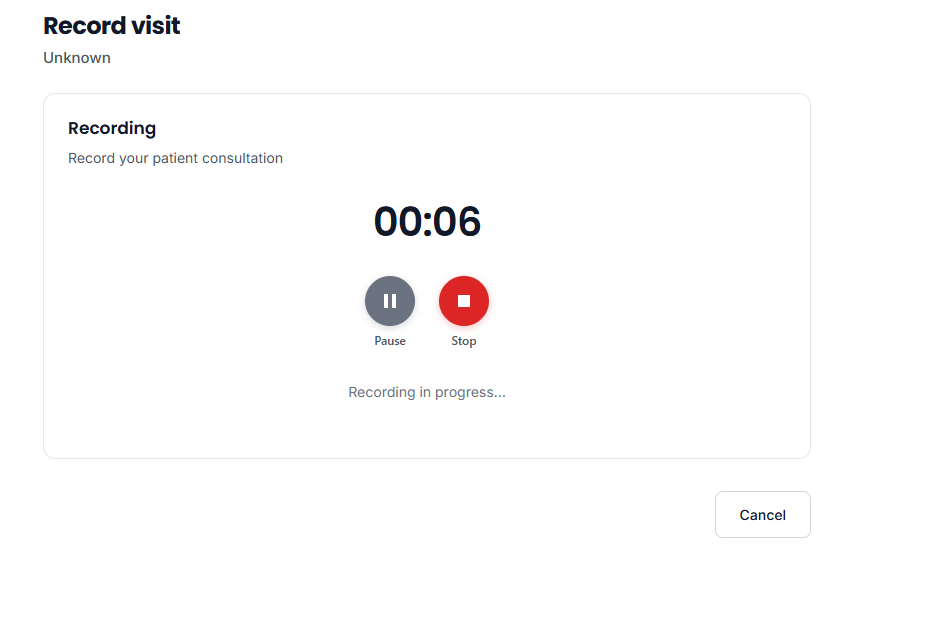
Record visit
Scryber record visit screen used to capture a neurology patient encounter
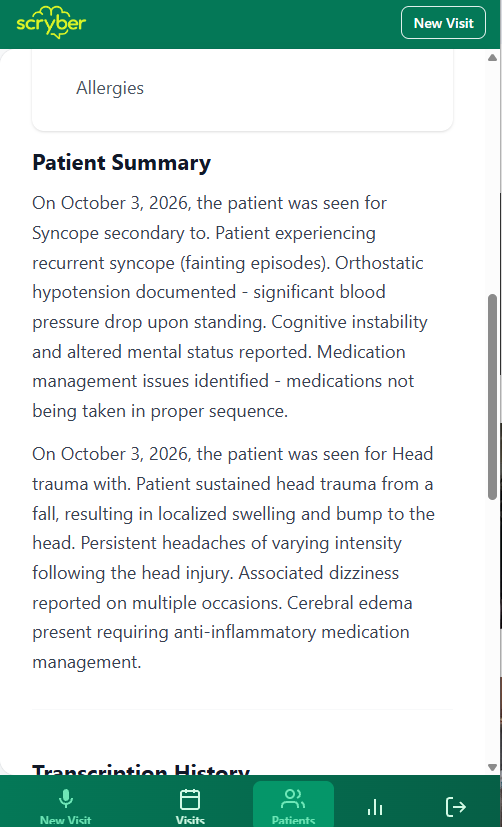
Patient summary
Scryber patient summary screen organizing clinical details from a neurology visit
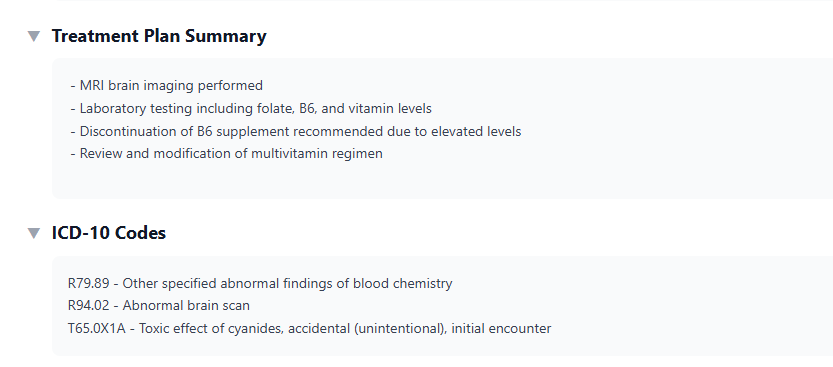
Treatment summary and ICD-10 suggestions
Scryber treatment summary with suggested ICD-10 codes for a neurology visit
Then, revenue visibility
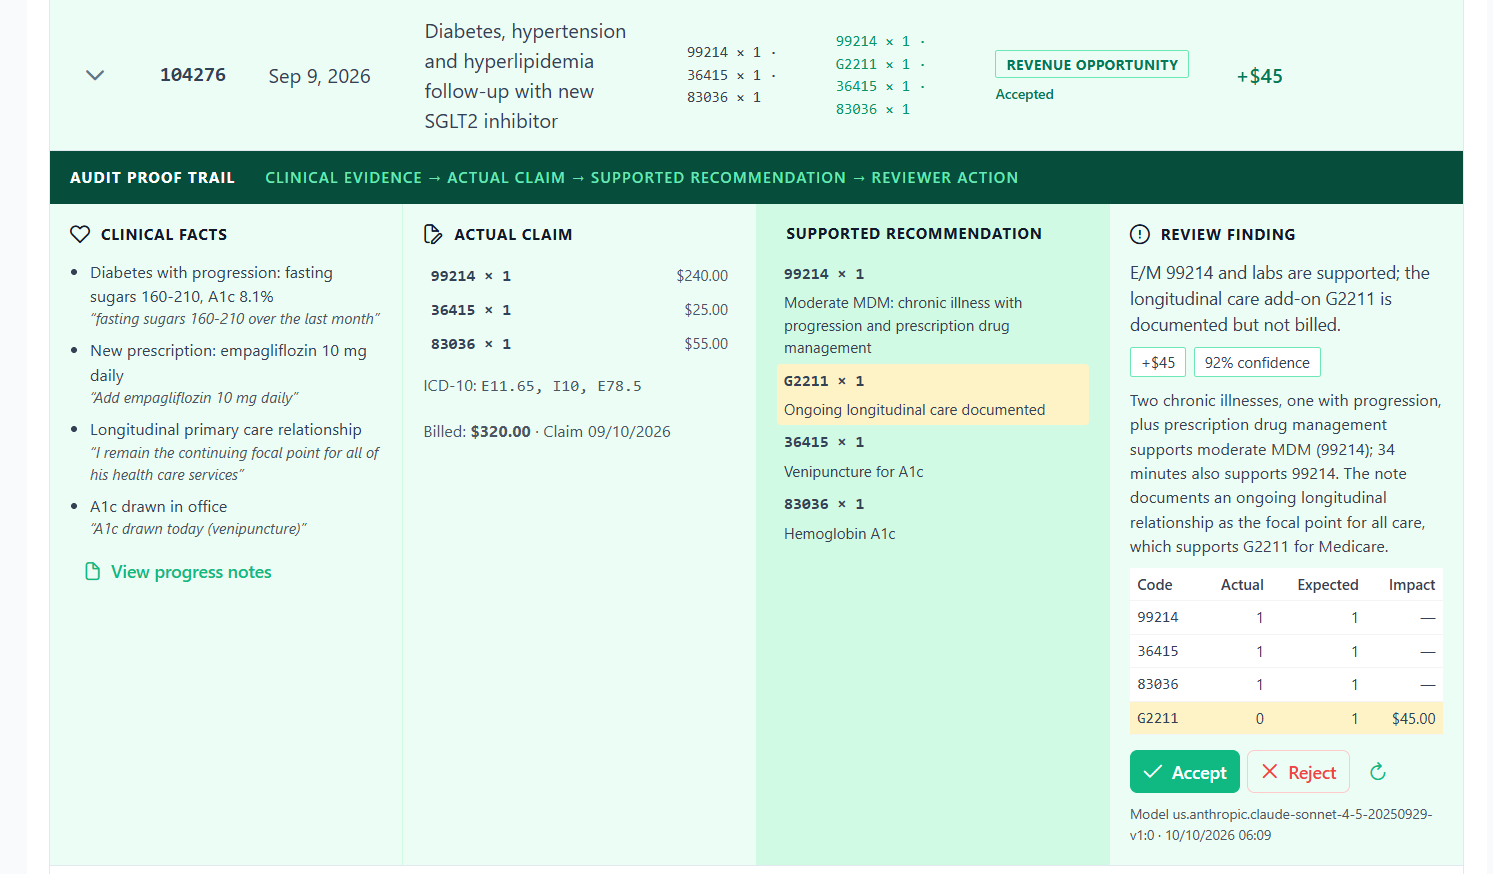
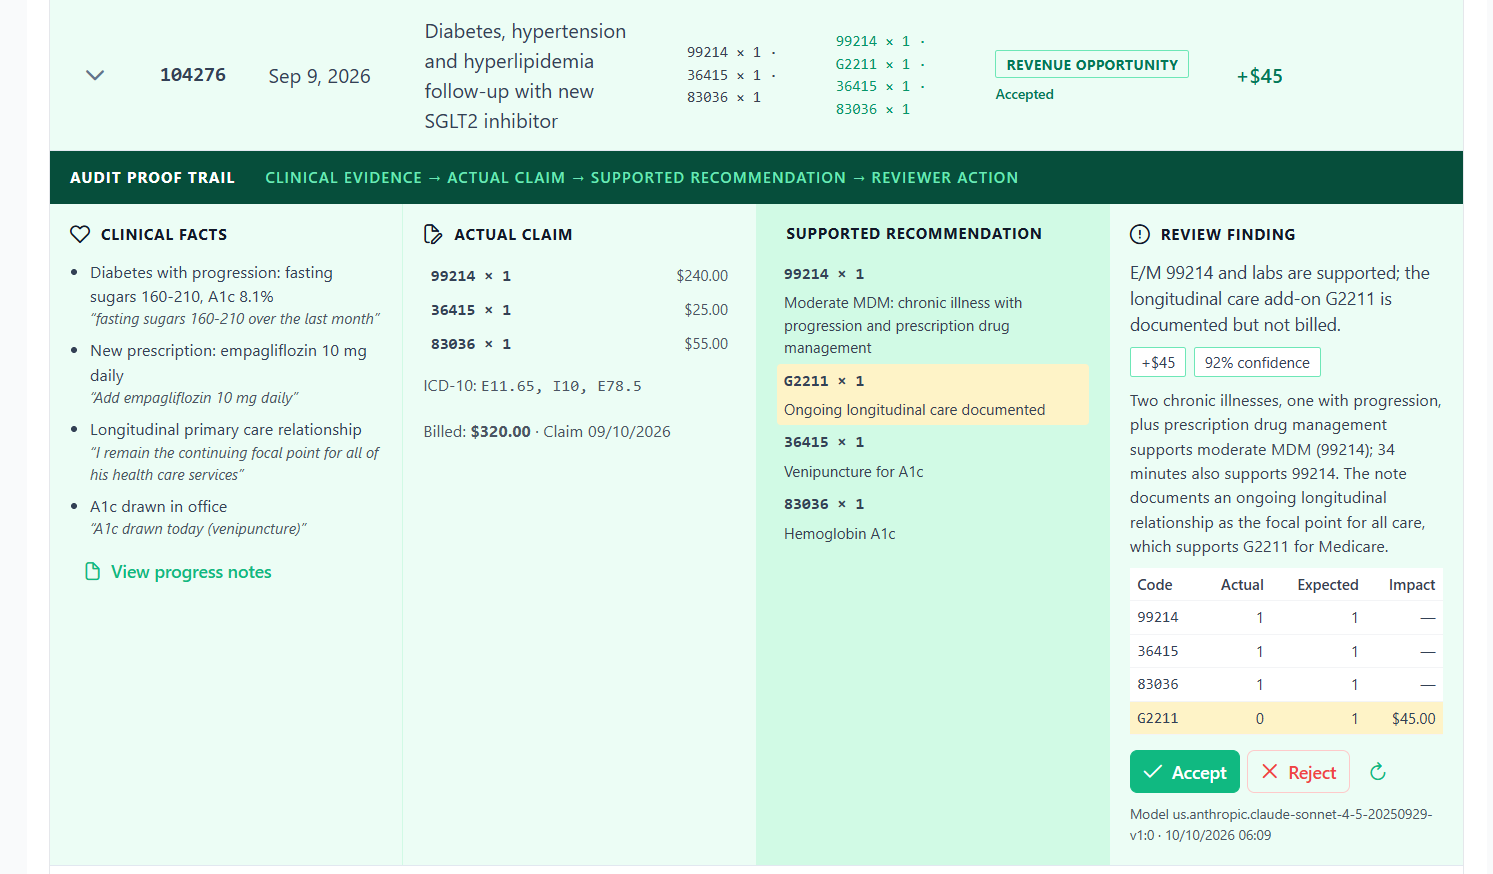
Claim analysis
Scryber claim analysis screen highlighting a revenue opportunity for a neurology claim
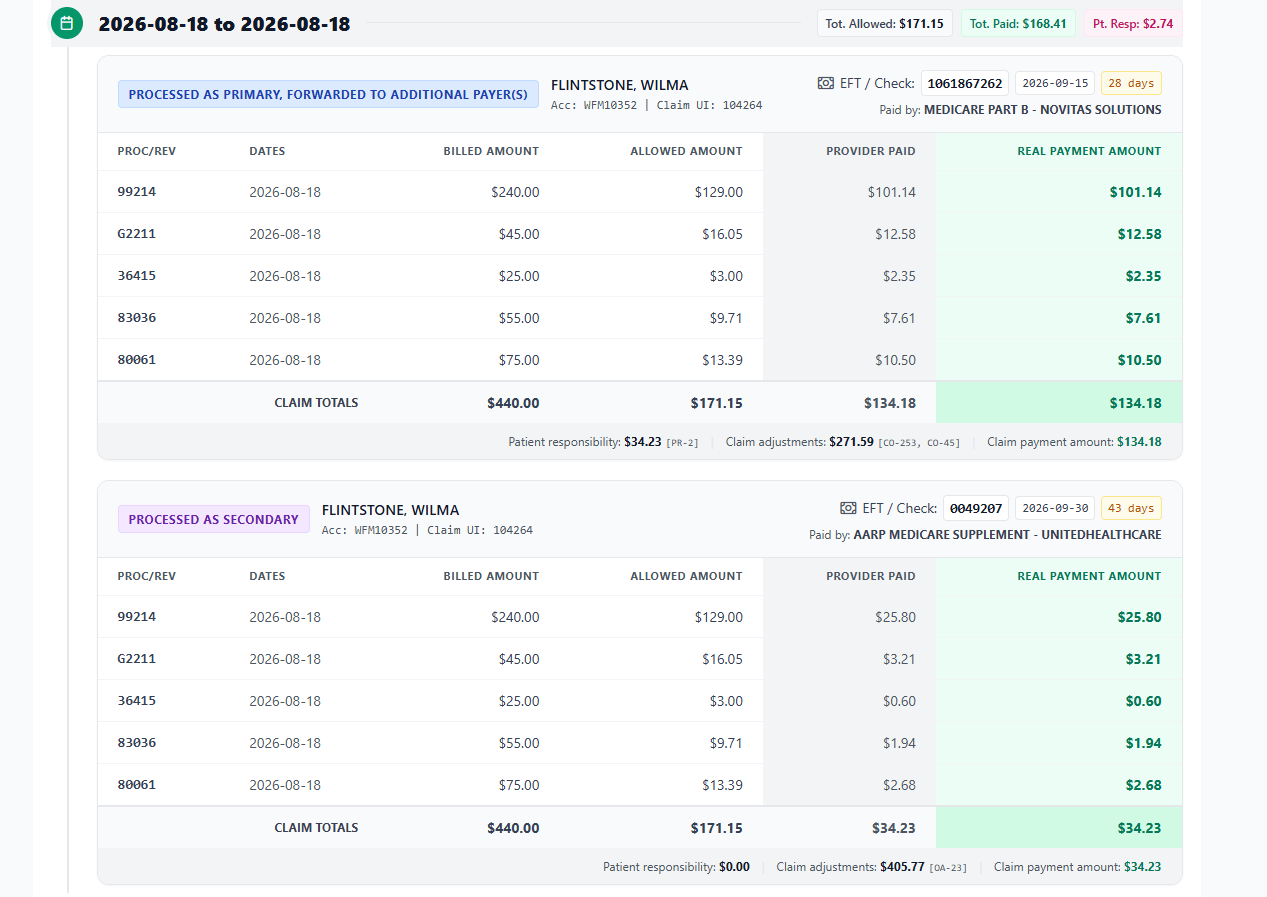
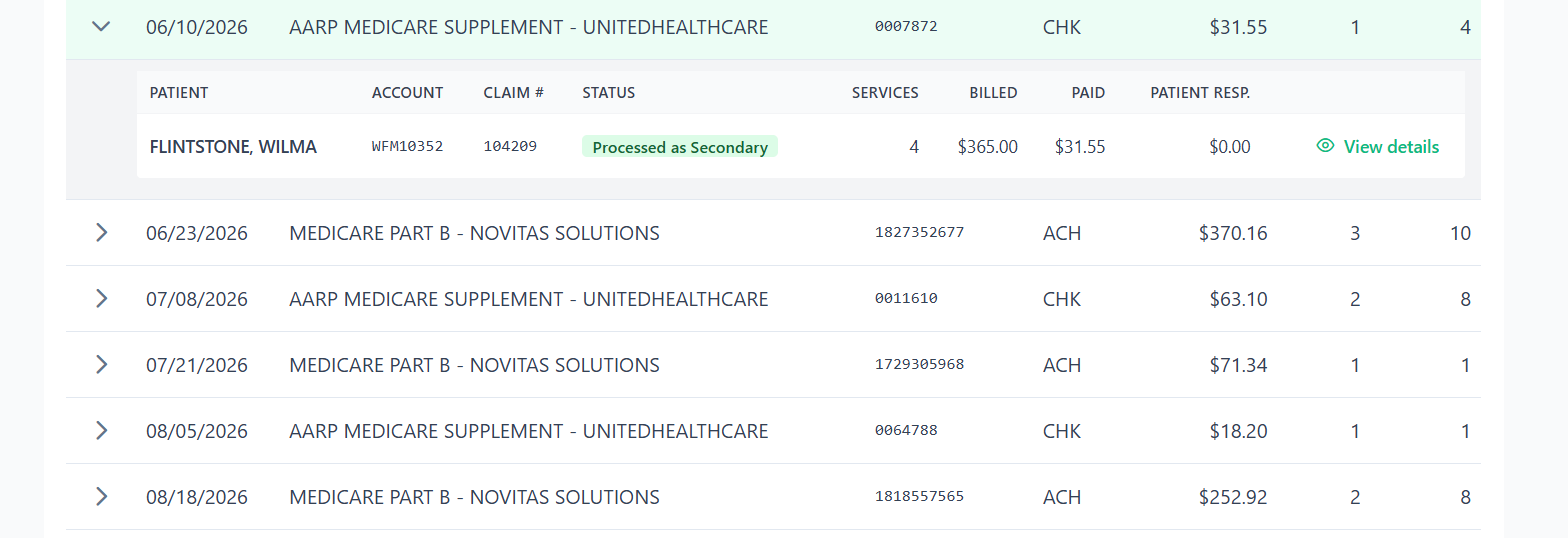
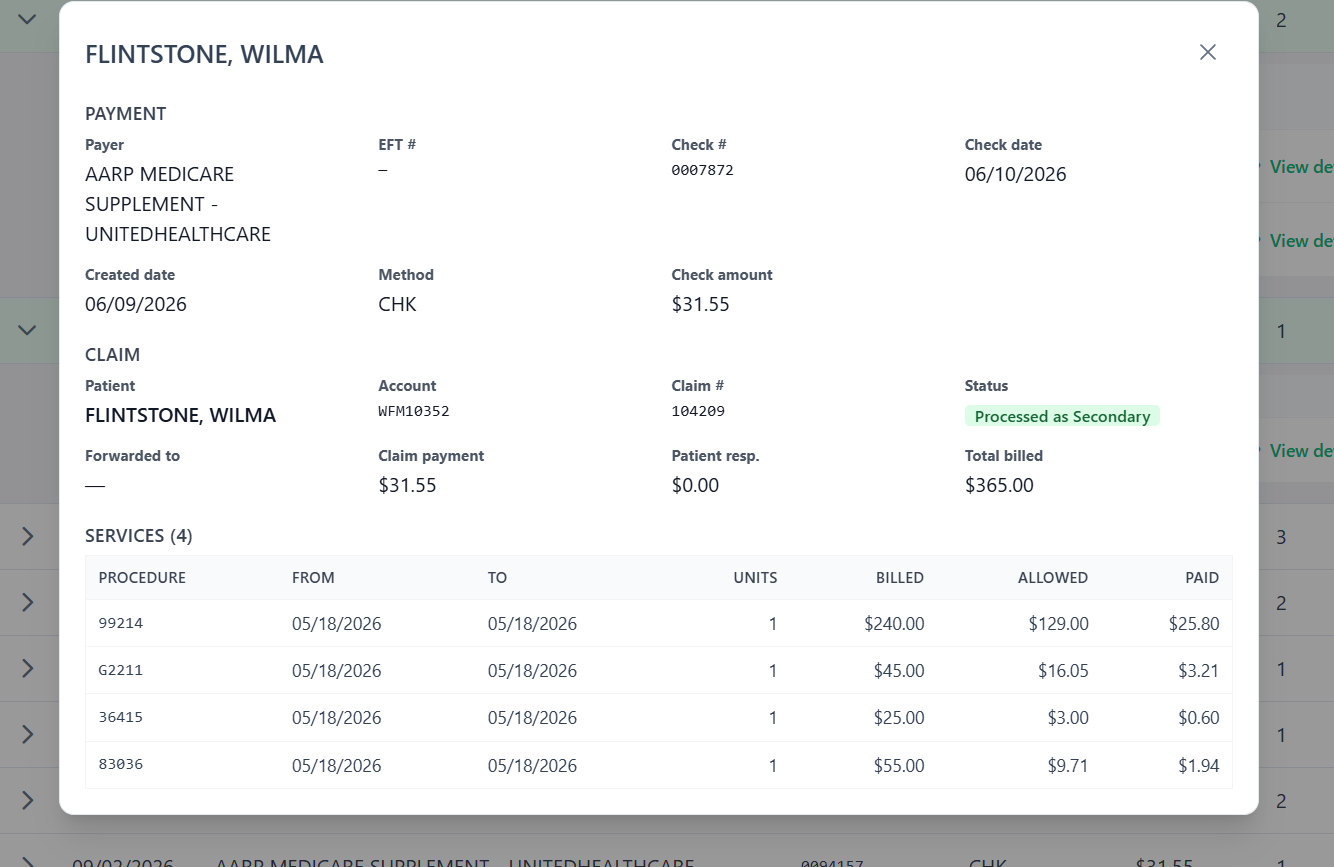
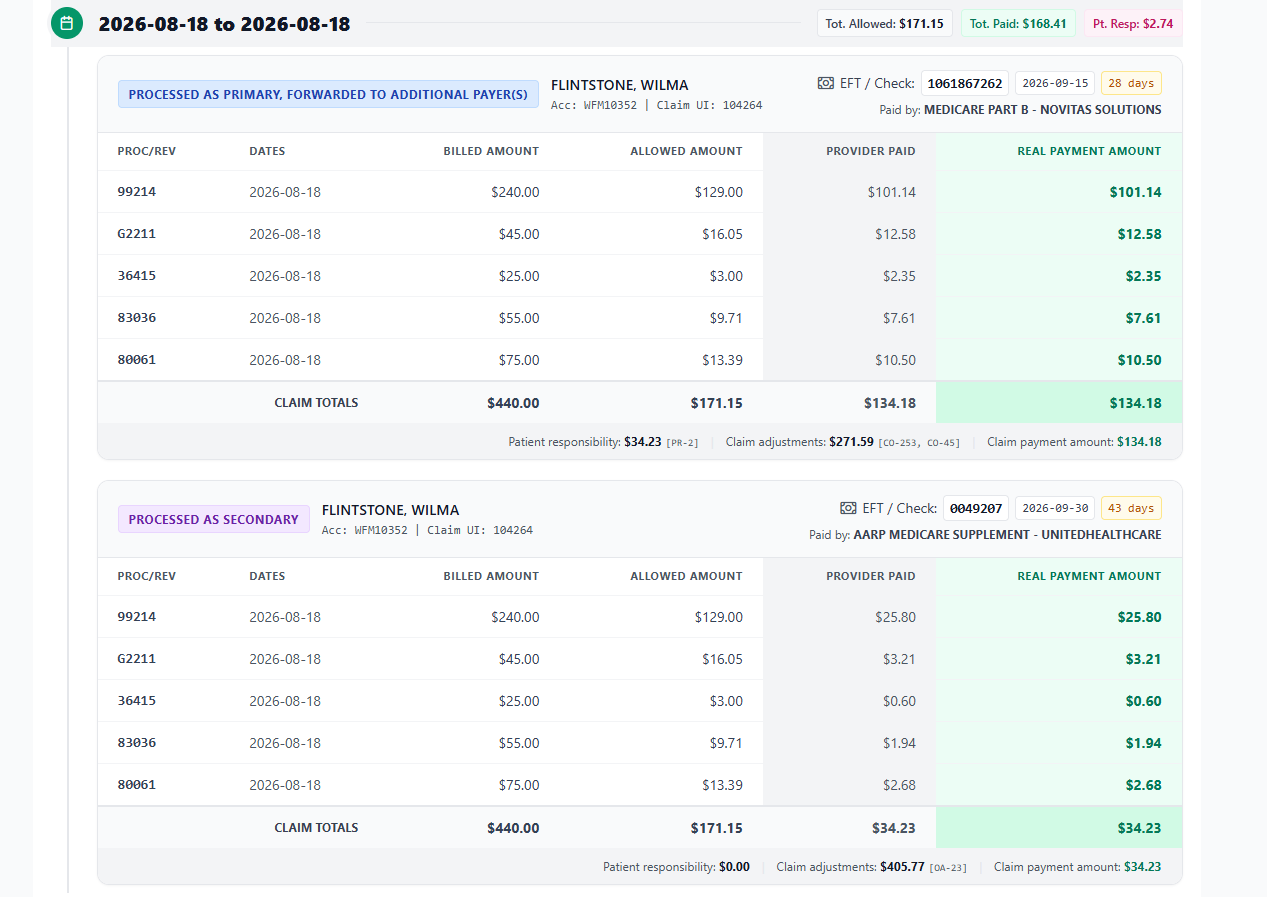
Patient payment
Scryber patient payment view showing primary and secondary payer payments by procedure code

The Problem

Neurologists Didn't Train for a Decade to Spend Half the Day on Paperwork

Every neurology practice faces growing pressure to improve patient access, increase provider capacity, and operate more efficiently. Yet providers spend hours each day on documentation, coding review, and administrative tasks. The result is longer patient wait times, fewer available appointments, and less time focused on patient care.

1.77 hrs
Documenting Outside Office Hours Daily
US office-based physicians reported an average of 1.77 hours per day documenting outside office hours — adding work beyond scheduled office time.
20%
Of Billable Codes Left on the Table
About 1 in 5 visits was undercoded in a family-medicine study — potentially reducing reimbursement for care already delivered.
50 Days
Average New Patient Wait
Commercially insured patients waited about 50 days on average. In a separate Medicare study, 18% waited over 90 days for their first neurology appointment. Long wait times hurt patient access, reduce referral confidence, and cost practices valuable new patients.
Sources & Methodology

Statistics reflect findings from published third-party research and illustrate broader challenges facing physicians and neurology practices. They are not measured Scryber customer outcomes. Individual practice experiences vary.

Documentation — outside office hours, not total daily time

A nationally representative analysis of the 2019 National Electronic Health Records Survey found that US office-based physicians reported a mean of 1.77 hours per day documenting outside office hours. This is self-reported documentation time outside office hours, not total daily documentation time or the percentage of the working day spent documenting. It is not a neurology-specific result.

Gaffney A, Woolhandler S, Cai C, et al. “Medical Documentation Burden Among US Office-Based Physicians in 2019.” JAMA Internal Medicine. 2022;182(5):564–566. doi:10.1001/jamainternmed.2022.0372. Read the study ↗

Coding — approximate undercoding rate, not omitted codes

Chao J, Gillanders WG, Flocke SA, Goodwin MA, Kikano GE, Stange KC. “Billing for Physician Services: A Comparison of Actual Billing with CPT Codes Assigned by Direct Observation.” The Journal of Family Practice. 1998;47(1):28–32. Read the study ↗

Trained observers compared billed evaluation-and-management levels with observed care for 3,791 visits to 138 family physicians. Codes agreed in 55% of encounters; the remaining 45% were evenly split between undercoding and overcoding, implying about 22.5% undercoding. The retained 20% headline is a coarse approximation of that visit-level finding. The study did not establish that 20% of eligible billing codes were omitted, quantify lost revenue, or measure current neurology practices.

Neurology waits — two different patient populations

Laffargue EK, et al. “Neurology Wait Times After Primary Care or Emergency Department Visits Among the Commercially Insured Population in the United States.” Neurology, American Academy of Neurology. 2026. doi:10.1212/WNL.0000000000218008. Read the study ↗

Analysis of 114,034 commercially insured people using 2019–2023 claims found a mean wait of 49.7 days, rounded here to 50 days; the median was 25 days. Waits were measured from a preceding primary-care or emergency-department visit to a new neurology visit, not an exact recorded referral date.

Lin CC, Muthukumar L, Reynolds EL, Hill CE, Esper GJ, Callaghan BC. “Wait Time to See a Neurologist After Referral Among Medicare Participants.” Neurology, American Academy of Neurology. 2025;104(3):e210217. doi:10.1212/WNL.0000000000210217. Read the study ↗

A separate analysis of 163,313 Medicare beneficiaries using 2018–2019 data found that 18% waited more than 90 days; the median wait was 34 days. This is not the same cohort as the 50-day average.

The Platform

Built for the Complexity of Neurology.

Generic AI scribes were built for 15-minute primary care visits. Neurology is different - 60–90 minute workups, subspecialty vocabulary, complex coding hierarchies. Scryber was trained on it all from day one.

TranscryberLive

AI Transcription That Speaks Neurology

Transcryber listens to every patient encounter and generates complete, neurology-specific SOAP notes automatically. It understands nerve conduction velocity, Todd's paralysis, complex partial seizures, and the full spectrum of neuro terminology and the clinical context behind them.

  • Handles 60–90 minute complex neuro workups
  • Neurology vocabulary trained; not generic medical
  • SOAP notes ready before you leave the room
  • Works with any EHR - easily copy and paste notes into the EHR of your choice
  • English and Spanish encounter support
VisualyzerLive

Revenue Intelligence, Not Just Reports

Visualyzer turns every patient encounter into financial clarity. See payments received, balances outstanding, and cash flow trends across your practice so you can make smarter decisions and focus on patient care.

  • Gain complete visibility into what has been paid, what is pending, and what remains to be collected for every patient visit.
  • Earned vs. pending vs. at-risk visibility
  • Infusion margin tracking (drug cost vs. reimbursement)
  • Month-over-month revenue trend reporting
Coming December 2026

Optimyzer - AI-powered billing optimization. Capture every dollar earned and accelerate collections.

What You Gain

Visibility from Visit
to Payment.

Transcryber and Visualyzer work together so every encounter is documented accurately and every dollar is tracked clearly. From the moment a patient walks in to the moment payment lands.

+3
More Patient Visits Per Day

Transcryber helps reduce documentation bottlenecks so your neurologists can potentially see more patients without extending their day.

TranscryberIllustrative model — methodology below
$187,500
In Additional Annual Revenue

Potential additional revenue from three more completed visits per day, assuming $1 million in annual revenue at 16 visits per day.

TranscryberIllustrative model — methodology below
+30%
Revenue From Ancillary Services

30% improvement in ancillary revenue achieved at Scryber's founding neurology practice. Reported by Scryber; independent verification pending. Results may vary.

VisualyzerFounding practice outcome — methodology below
100%
Visibility Into Every Patient Visit

See what you've been paid, by whom, for every patient encounter captured by Scryber - practice-wide, provider by provider.

VisualyzerIntegrated data only — methodology below
Sources & Methodology

Evidence status: the capacity and additional-revenue headlines are conditional models. The ancillary-revenue improvement is a founding practice outcome reported by Scryber, with independent verification and supporting financial documentation pending. The visibility headline is a product capability whose complete coverage remains under review. Published research below provides context, not proof of these exact outcomes.

+3 more patient visits per day

Illustrative Scryber Model — conditional scenario; time-saving assumption requires validation

Updated scenario: 1.77 hours × 60 minutes = 106.2 minutes of documentation burden. Retaining the original model's assumed 60% recovery rate gives 106.2 × 60% = 63.72 minutes. Capacity formula: usable time recovered during the clinical day ÷ appointment length. If 63.72 minutes can actually be freed within the clinical day, 63.72 ÷ 20 = 3.186 slots: three whole additional 20-minute visits with 3.72 minutes remaining. At 30 minutes per visit, this yields two whole slots instead.

The 1.77-hour input comes from Gaffney et al.'s analysis of the 2019 National Electronic Health Records Survey: mean self-reported documentation outside office hours among US office-based physicians, not total daily documentation, an in-clinic time saving, or a neurology-specific result. The 60% recovery rate and 20-minute slot are model assumptions, not findings from that study. After-hours documentation savings do not automatically become in-day appointment capacity; the +3 scenario requires separately validated, usable in-clinic time savings.

Sinsky et al. observed 57 physicians in four specialties, none neurology: 49.2% of office time was EHR and desk work. This is not all documentation or all recoverable time. Ma et al.'s Stanford pilot of another ambient scribe included 45 physicians and no neurologists: median daily documentation time fell by 6.89 minutes and total EHR time by 19.95 minutes. These overlapping measures must not be added together. Neither finding substantiates 63.72 usable in-clinic minutes recovered or three extra visits.

Neurology context: Nuwer et al.'s historical analysis of 1998 Medicare services inferred 15–25 minutes per follow-up and 50–60 minutes per new patient/consult from service levels. It is not a current appointment-duration study. A 20-minute assumption fits that historical follow-up range, not a typical mixed new/follow-up schedule. Three new visits at those historical durations would require 150–180 minutes.

Review: confirm actual in-day time savings and appointment mix before treating +3 as achievable. The evidence supports “reduced documentation burden,” not a guaranteed visit increase. This scenario assumes recovered time can be scheduled, staffed, and filled; after-hours savings alone do not create clinical slots. Actual capacity depends on practice workflow, appointment length, patient complexity, and provider scheduling.

Additional Visit Capacity

Illustrative Scryber Model — $187,500 in potential additional annual revenue

Increased patient capacity represents a separate revenue opportunity and should be calculated as:

Additional annual revenue = Additional completed visits per day × Average collected revenue per visit × Annual clinical days

Using the revised scenario of three additional visits per day and the original assumption of $1 million in annual revenue at 16 visits per day:

  • Current annual revenue: $1,000,000
  • Current daily visits: 16
  • Potential daily visits: 19
  • Potential incremental annual revenue: $187,500

$1,000,000 × (19 ÷ 16 − 1) = $187,500

This assumes consistent reimbursement, patient mix, and clinical working days. It represents potential additional revenue, not profit, and excludes incremental operating expenses and product costs.

Source: CMS Neurology Office Visit Costs ↗, Centers for Medicare & Medicaid Services. Current fee schedules and payer contracts should be used for practice-specific projections.

+30% ancillary revenue improvement — actual outcome observed at Scryber's founding neurology practice.

Classification — Measured Scryber Founding Practice Outcome

The 30% improvement was an actual result achieved by the neurology practice that helped develop and validate Scryber. It is a practice-specific outcome, not an industry benchmark, third-party research finding, or projected financial model.

Evidence classification: Founding practice outcome, reported by Scryber. Independent verification and supporting financial documentation remain pending.

The supporting evidence should establish the baseline and comparison periods, ancillary revenue categories included, whether the improvement reflects billed charges or collected revenue, and how much of the improvement can be attributed to Scryber.

Measurement methodology:

Ancillary revenue improvement (%) = [(Post-implementation ancillary revenue − Baseline ancillary revenue) ÷ Baseline ancillary revenue] × 100

Relevant supporting research:

Approved marketing wording:

“30% improvement in ancillary revenue achieved at Scryber's founding neurology practice.”

Qualification: This represents a reported result from one practice, not a guaranteed outcome or independently validated industry-wide benchmark. Results may vary by practice, payer mix, service mix, and billing operations.

100% visibility into every patient visit

Scryber Product Capability — claimed scope; complete coverage requires product validation

Intended workflow: connect encounter records with available billing, claim, payment, and reimbursement data so practices can follow each captured encounter's financial lifecycle across providers. Visibility depends on the data sources actually integrated into Scryber, their completeness, and successful matching and reconciliation.

Encounters, claims, or payments not integrated into Scryber are outside this scope. Missing feeds, failed imports, unmatched records, and payment delays can leave gaps; an unpaid or pending claim is not proof of missing data, and a captured encounter alone does not establish complete payment visibility.

Review required: this marketing website does not include the Visualyzer ingestion/reconciliation system or coverage audit needed to verify the 100% statement. Retain it as a verified capability only after confirming every in-scope encounter is accounted for, with missing or unmatched financial records explicitly surfaced. No academic study can establish Scryber's integration coverage. If not confirmed, proposed wording is “Visibility into patient encounters captured by Scryber,” without a percentage, subject to approval.

Financial and capacity estimates are illustrative and based on published industry data and stated assumptions. They are not guarantees of Scryber customer performance. Actual results vary based on provider schedules, patient mix, reimbursement, coding practices, payer mix, workflows, and services offered.
How It Works

From First Word to
Final Payment.

Every step from the patient encounter to collected revenue - automated, auditable, and built for neurology.

01

Physician Sees the Patient

Physician walks in the room. Transcryber listens in real time - no extra steps.

Ambient AI captures every spoken word across the full visit.

02

AI Transcribes in Neurology Language

Scryber's neurology-specific context layer converts the conversation into structured clinical language.

Neuro terms, laterality, severity, chronicity - all captured correctly the first time.

03

SOAP Note Auto-Generated

A complete, EHR-ready SOAP note is generated and ready to review - formatted to match your system.

Paste directly into your EHR. Average review time under 90 seconds.

04

Billing Codes Suggested

Scryber identifies the optimal CPT and ICD-10 codes based on the documented complexity of the visit.

E&M level, procedure codes, and modifiers - surfaced automatically, not guessed.

05

Revenue Visibility Unlocked

Every coded visit flows into Visualyzer - giving you a real-time view of expected vs. collected revenue.

Know what you're owed, what's pending, and where the gaps are.

Inside Visualyzer

Real revenue and claim screens from the product, after the note is complete.

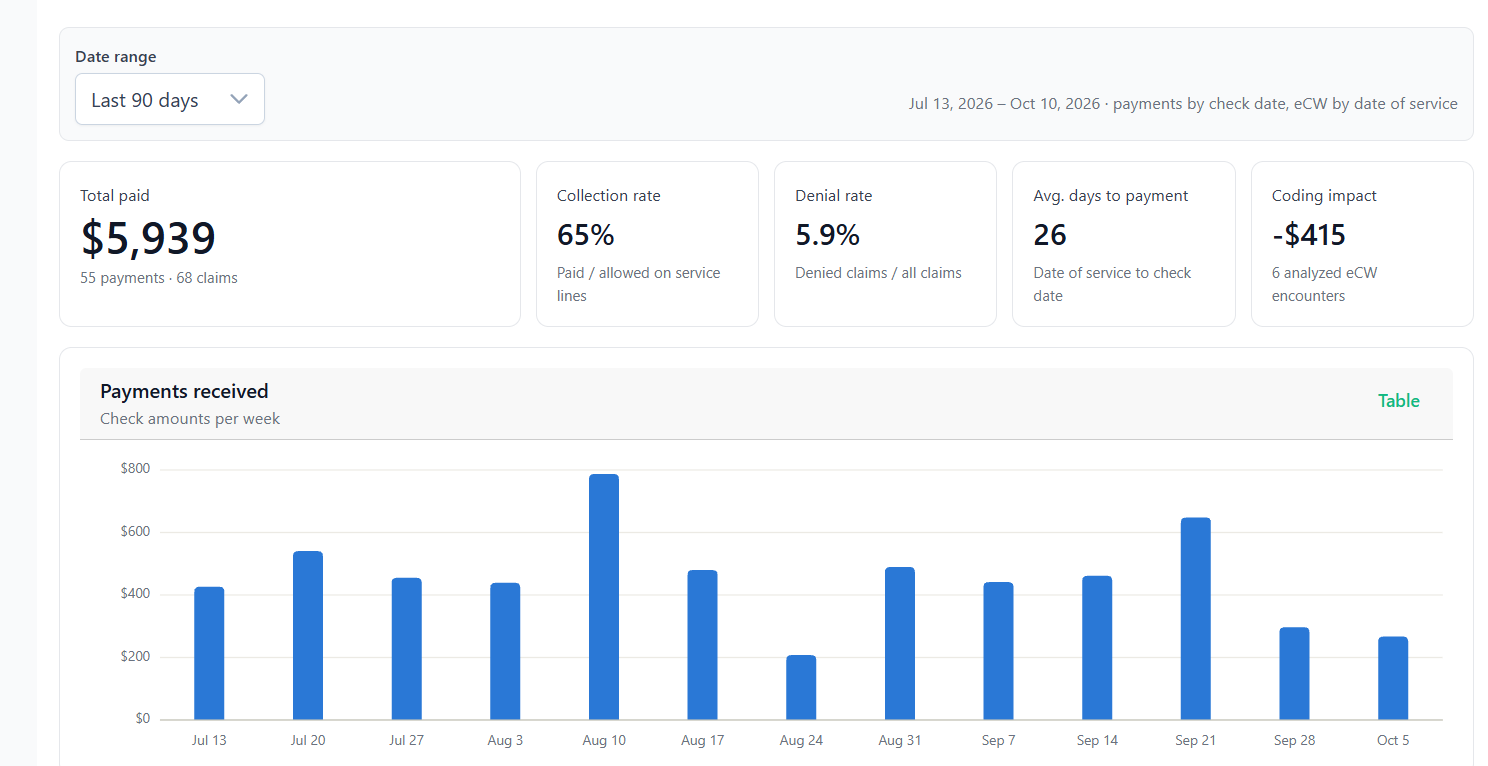
Revenue dashboard
Visualyzer dashboard showing total payments, collection rate, denial rate, days to payment, and weekly payment trends
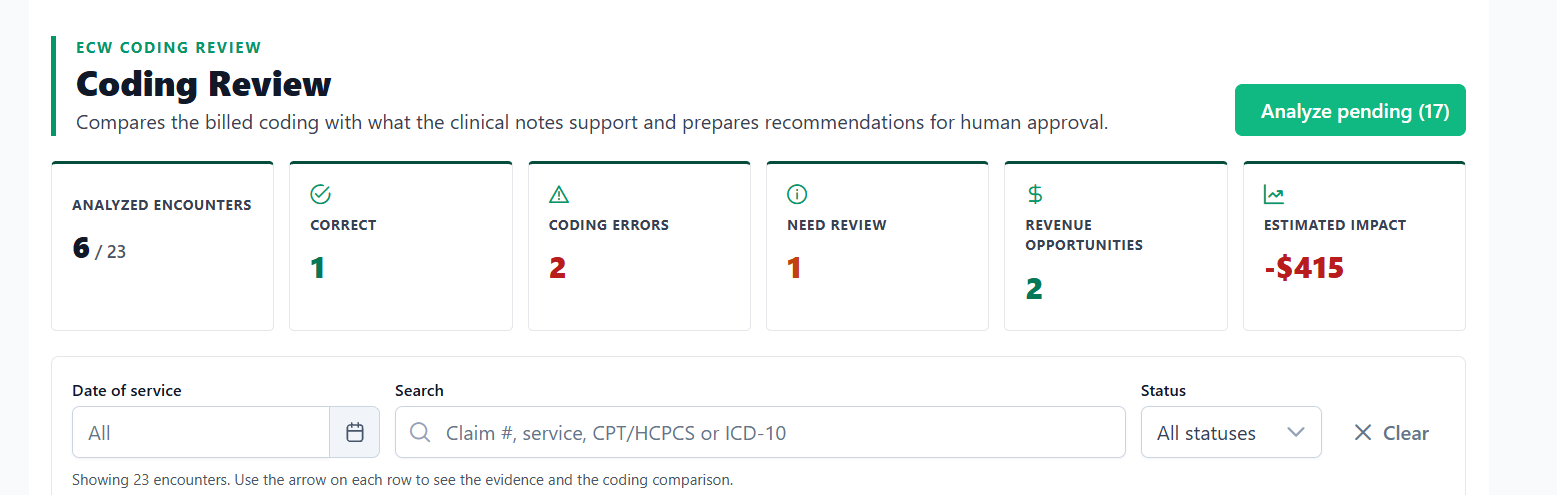
Coding review
Coding review overview showing analyzed encounters, coding errors, revenue opportunities, and estimated impact
Claim evidence review
Scryber claim analysis screen reviewing supporting evidence for submitted codes
Reconciliation
Scryber reconciliation view comparing billed, allowed, and paid amounts
Payment details
Scryber patient payment details showing payer remittance information
Patient payment
Scryber patient payment view with primary and secondary payer claim totals by procedure code

Pricing

One plan. Everything you need.

Scryber Pro gives you the complete Scryber experience — no tiers to compare, essential features locked behind upgrades, or complicated add-ons.

You get everything we've built to help reduce documentation burden, improve coding accuracy, and make the business of neurology easier.

60-Day Free Trial — Then $85/month per user.

60-Day Free Trial
Scryber Pro

Transcryber + Visualyzer

60 days free, then

$85
per user per month

Unlimited transcriptions — no monthly cap

Full access for 60 days. No subscription charges during your trial.

Start Your 60-Day Free Trial

Everything included

  • Real-time AI transcription for every patient encounter
  • Unlimited transcriptions — no monthly cap
  • Neurology-specific vocabulary and context layer
  • Auto-generated SOAP notes and neuro-specific forms
  • Patient history: a transcription history and an AI patient summary across all prior visits for every patient
  • Revenue dashboard — visit to payment visibility
  • Outstanding claims and aging AR tracking
  • Identify undercoded and missed billing opportunities
  • HIPAA-compliant, audit-ready documentation
  • Advanced reporting and custom exports
  • Priority support and onboarding

Prefer to evaluate first? Watch the three product demos or request a walkthrough.

Why We Built This

Built by Neurologists.
For Neurologists.

Dr. Patricio Espinosa

Co-Founder & Chief Medical Officer

Dr. Patricio Espinosa

Harvard-trained neurologist and founder of one of South Florida's leading neurology practices. With decades of experience treating patients across the full spectrum of neurological conditions, he understands firsthand what it takes to run a high-performing neurology practice and the operational challenges that hold even the best practices back.

His Story

For years, Dr. Patricio Espinosa built one of South Florida's leading neurology practices. He loved caring for patients, growing his team, and expanding access to neurological care. His practice was thriving.

But as the practice grew, so did the administrative burden. Hours each day were spent documenting patient visits, reviewing billing codes, chasing reimbursement issues, and trying to understand what had been paid versus what was still outstanding. The very success of the practice created new operational challenges that pulled providers and staff away from what mattered most: patient care.

Like many neurologists, Dr. Espinosa found himself spending too much time navigating paperwork and not enough time practicing medicine. He knew there had to be a better way.

Scryber was born from that experience. Not from a boardroom or a software company, but from the day-to-day reality of running a busy neurology practice. Every workflow, every form, every documentation template, and every billing optimization rule was designed to solve a problem that Dr. Espinosa personally encountered.

The result is a platform that helps neurologists spend less time documenting, gain visibility into practice performance, improve billing outcomes, and focus more of their energy on caring for patients.

Clinical Depth

Built for Every Neurology Encounter

Scryber's context layer is trained on neurology not general medicine. Every form, every code suggestion, every cash flow visualization is built around how neurology practices actually work.

First-Time Visits

Transcryber

Transcryber

New patient workups in neurology aren't 15-minute encounters, they're 60–90 minute deep dives with complex histories, multi-system findings, and nuanced diagnoses. Transcryber is built for exactly that: every symptom, every differential, every clinical decision is captured in neurology-specific language from the moment you start speaking.

Complex Chronic Care

Transcryber

Transcryber

The neurology context layer understands MS, Parkinson's, epilepsy, and migraine complexity. Capturing multi-diagnosis notes with precision.

Billing + Revenue

Chronic care management codes identified automatically. Every qualifying encounter is identified at its full value.

Follow-up Visits

Transcryber

Transcryber

Multi-problem follow-ups documented in full. Every active diagnosis, medication change, and clinical decision captured and structured.

Infusion Visits

Transcryber + Visualyzer

Transcryber

Auto-generates infusion-specific SOAP notes with drug name, dose, and administration time captured from dictation.

Billing + Revenue

Visualyzer tracks exact cost-to-reimbursement margin per drug - so you know your net on every infusion before you bill.

EMG / EEG Documentation

Transcryber

Transcryber

Neurology context layer understands nerve conduction terminology, waveform descriptors, and latency findings. Forms auto-populated from dictation.

Billing + Revenue

CPT codes matched to study complexity and clinical findings - no defensive undercoding.

Revenue & Cash Flow Visibility

Visualyzer

Billing + Revenue

Stop wondering whether you got paid for the last patient encounter. Stop wondering if the cash will arrive in time to cover payroll. Visualyzer gives you a real-time view of your revenue and cash flow - so you can de-risk collections, plan with confidence, and spend your energy on patients instead of chasing down payments.

Product Demos

Watch Scryber at work

Three short walkthroughs recorded in the real product: the visit workflow, Visualyzer and patient insights, and the coding review. Under six minutes, all together.

View all Scryber product videos

Visit our YouTube channel (opens in a new tab)
Request a Demo